Contents
Finding a report
You can view a detailed report for a specific service by clicking View Report after locating it within its group and service.

Viewing a report
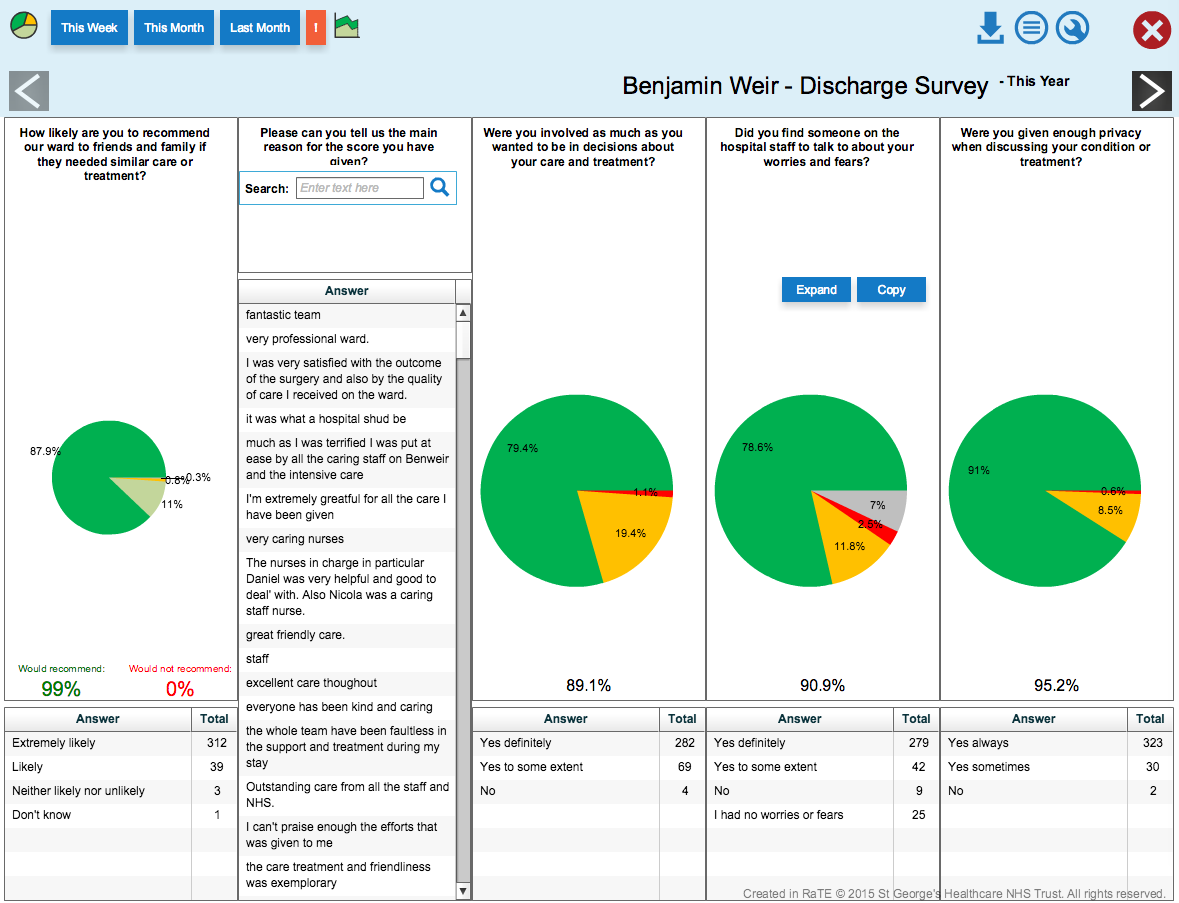
The screenshot below will be your default view when opening any report.
- The detailed report will show you a breakdown of responses.
- Each column represents a question contained in your survey or audit.
- Clicking on a section of a pie chart will filter the other charts; i.e. clicking on the answer “Extremely likely” will show you how respondents who selected that option answered your other questions. Right clicking will reverse this filter.
Copying your data
![]()
Hovering over a question will present you with the following options.
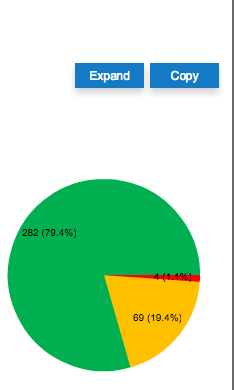
- Clicking Copy in a pie chart column will allow you to save the pie chart as an image.
- Clicking Expand in a Pie chart column will display the pie chart at a larger size. Having selected this option, you can click Copy to save the piechart in a larger size.
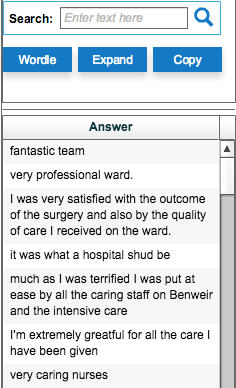
- Clicking Copy in a free text column will copy all the text responses to your clipboard. This means you can now pate all content directly into a document.
- Clicking Expand in a free text column will open up all text responses in a larger format.
- Clicking Wordle in a free text column will present you with the following.

This is a Wordle. It takes all the free text comments responses, and increases their size based on how often they’re used.
Refining a report
- The pie chart icon will allow you to return to return to the pie chart view at any point. If you are already in the pie chart view, clicking this icon will display colour coded legends for each of the pie chart and the icon will change to a legends icon.
 Clicking this icon will return the charts to a tabular breakdown of responses.
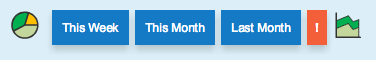
 - You can click on any of the time scales (Week/Month/Last Month) to filter the results to these particular time frames.
- The red exclamation mark will filter the results to display only negatively scored responses. This will help you to create action plans.
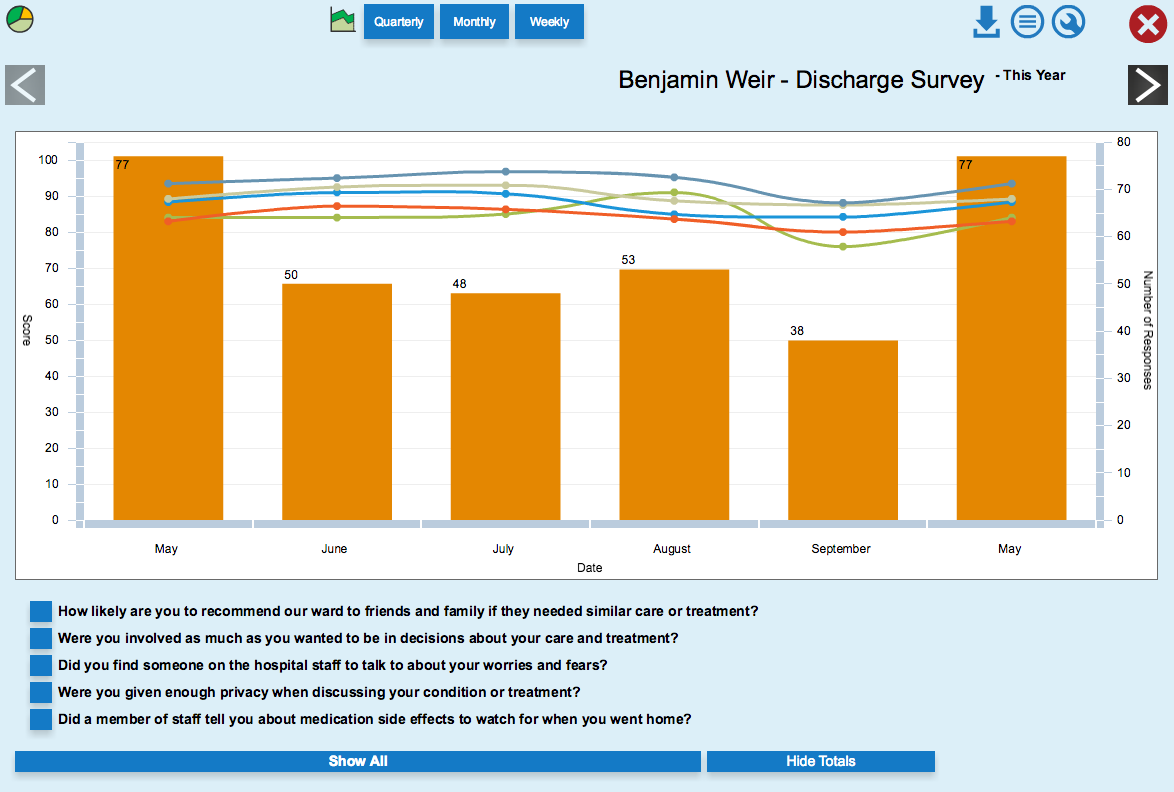
- The progress chart icon will display your results in a bar chart format. This is the best way to view the development of the responses over time. (Please see the section on Reports over time below for more information)

 At any point you can click the download symbol to download the entire report as a PDF document.
 The action plan icon will allow you to create an action plan within RaTE.
 The settings icon will allow you to customise the settings for the report. From here you can refine the responses to your specific needs. (see the section on Report settings below for more details)
- You can press the red X to close the report at any time.
Report settings
Having clicked the spanner icon you will be presented with the following options.
- To go back to your default view, you can click the blue arrow icon.
![]()
![]()
- You can use the Choose two dates area to view results between the dates chosen. You must press the green tick icon to confirm the chosen dates.
![]()
- Alternatively, you can select a specific year and month using the options displayed above.
- To alter the number of columns displayed on your screen, you can select the five columned screen icon.
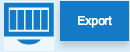
- You can export all response data as a spreadsheet by clicking Export.
Performance over time
Having selected the line chart icon, you will be presented with the following view.
You can limit the chart to a single question by clicking it. 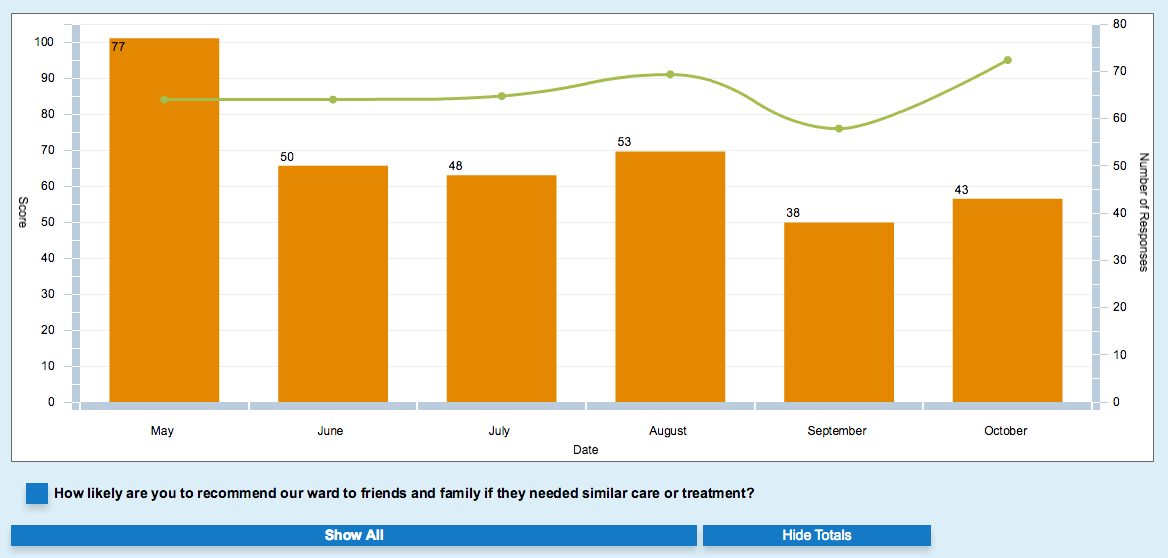
Clicking Hide Totals will remove the bars from the chart, leaving you with the progress lines.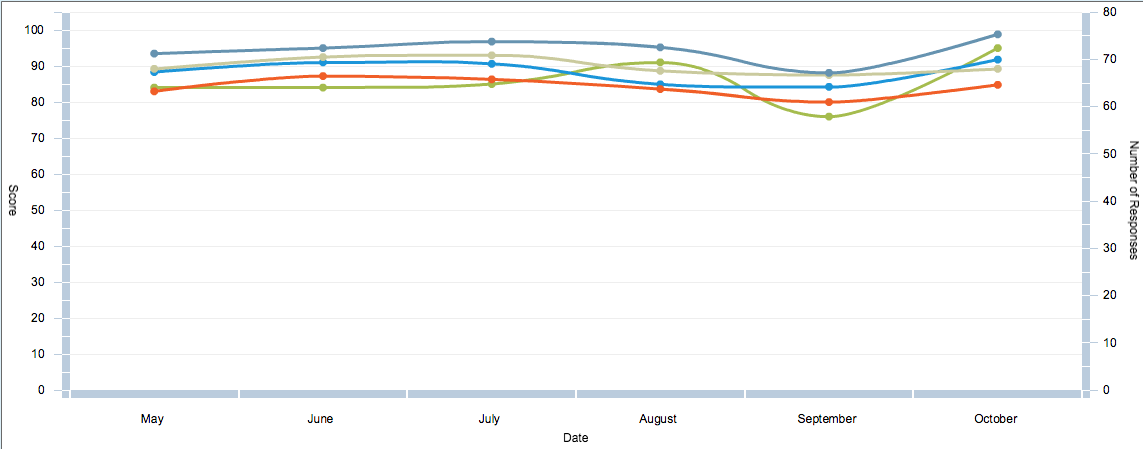
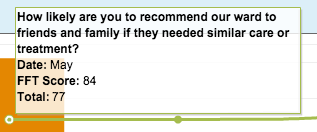
Hovering over a point in the progress will give you more information.