When we carry out surveys or audits, it is important to measure any changes; both for individual questions and an overall score for the entire audit / survey.
To do this, we apply “scores” to each answer; with the most positive answers getting the highest score and the most negative getting the lowest.
If an answer is neither positive nor negative, we can simply not apply a score to it.
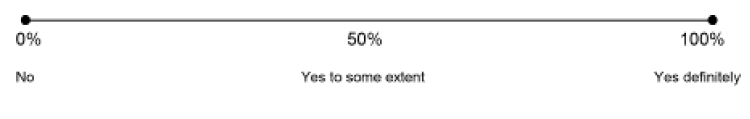
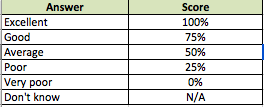
Here is an example of a question you might use:
How would you rate our service?
- Excellent
- Good
- Average
- Poor
- Very poor
- Don’t know / I’m not sure
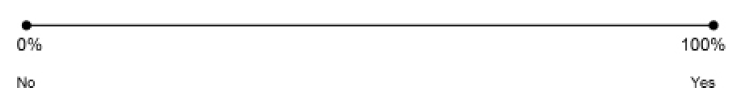
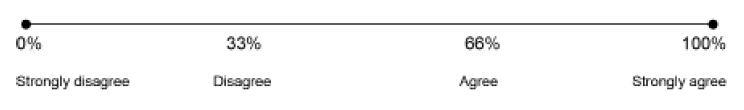
To apply scores to these, we need to identify the best and worst answer. The best answer gets a score of 100%, and the worst gets 0%.
We also need to identify neutral answers (if any). Finally, we need to apply a sliding scale between 0% and 100% for all answers that lie between the best and worst.
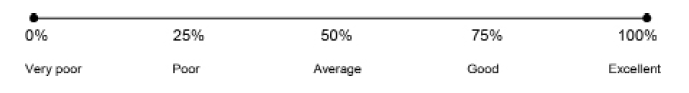
This would give us the scores below:
Applying scores to these answers allows us to “weight” them and calculate an overall score when we get many responses.
This score will ignore the non-applicable “N/A” answers, and take into account every other answer provided.
If you do not enter any scores for your answers, will set them to “N/A” by default, and no score will be applied; this is useful for questions like “What type of appointment did you have today?” where there is no positive or negative answer.
Calculating Scores
When we get responses to our audit or survey, uses the scores you have chosen to calculate an overall score.
This score is useful for service managers to measure overall improvement over time.
It is calculated in the following way. Imagine we get the following responses to our question:
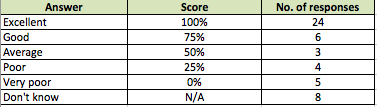
We first of all disregard the “Don’t know / I’m not sure answers” (you may choose to score these depending on your survey – this is for example purposes only).
We then look at each answer and apply the score weightings. To do this, we multiply the number of responses by the score. This gives us the following:
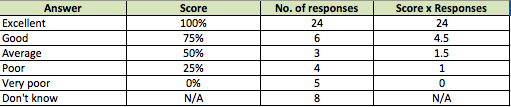
Next, add all the numbers in the “Score x Responses” and “Number of responses” columns.
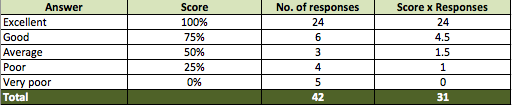
We now calculate our percentage score by dividing the “Score x Responses” total by the “Number of responses” total:
31 divided by 42 = 0.73809 = 73.8%
This gives us our final score of 73.8% for this question. This is a useful score because it takes into account every answer that has been made – when we repeat our audit or survey, we can compare these scores to see if there has been any change.
Scores in your reports
displays scores in two ways:
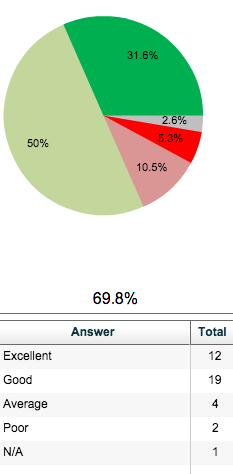
1. Underneath each pie chart of a scored question, with answers coloured red/amber/green (RAG) according to their score.
2. On a line graph to track progress over time.
![]() Click this icon in your report – This will show you the below graph.
Click this icon in your report – This will show you the below graph.
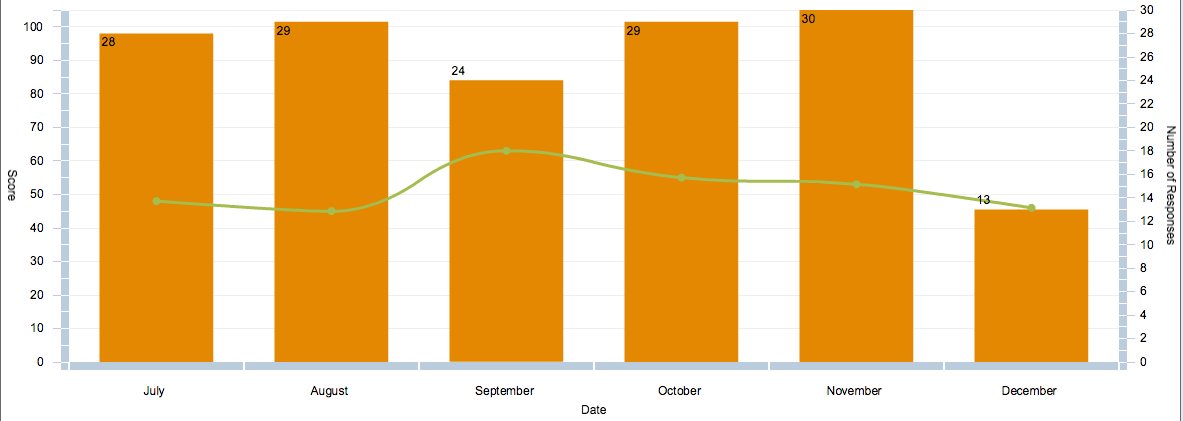
The line shows you the score for that question, and the orange bars show the number of responses you have had in each time period.